Microservice Advance: Centralized Logging with the ELK stack
Introduction#
Managing logs in a microservices architecture is very complicated. The ELK Stack (Elasticsearch, Logstash, and Kibana) is a centralized solution for collecting, storing, analyzing, and visualizing logs.
Sync Log Storage: Aggregate logs into one place from different services.
Real-Time Monitoring: Observe system health and performance.
Advanced Search and Filtering: Quickly pinpoints the issue.
Visual Dashboards: Gain insights into Kibana.
This article discusses setting up ELK, configuring Logstash & Filebeat, structured logging, and best practices for improving observability, debugging, and system reliability.
Why Centralized Logging?#
An application has various services to perform a particular request in the microservices architecture. Each service produces its own log, thus making the overall issue tracing difficult. A centralized logging system is primarily needed to manage all logs in one place and enhance the feasibility of debugging and monitoring.
Zipkin offers some of the best in tracing the request as well as seeing how data flows between microservices. However, it does not have any long-term storage of logs or in-depth insights it can provide. This is where the ELK Stack comes into play.
How ELK Complements Zipkin?#
The ELK Stack helps in:
- Deep Log Analysis— Helps understand errors and patterns across services.
- Long-term Storage— Save logs for future debugging and analysis.
- Powerful Search & Filtering— Quickly find specific logs with ease.
- Real-time Monitoring & Alerts— Detects and notifies about issues immediately.
- Centralized Portal— Aggregate all logs for easy debugging.
Thus, using ELK with Zipkin and other traceability tools allows the developer to see the whole observability of their microservices in accessing, trapping, and improving the performance of the system.
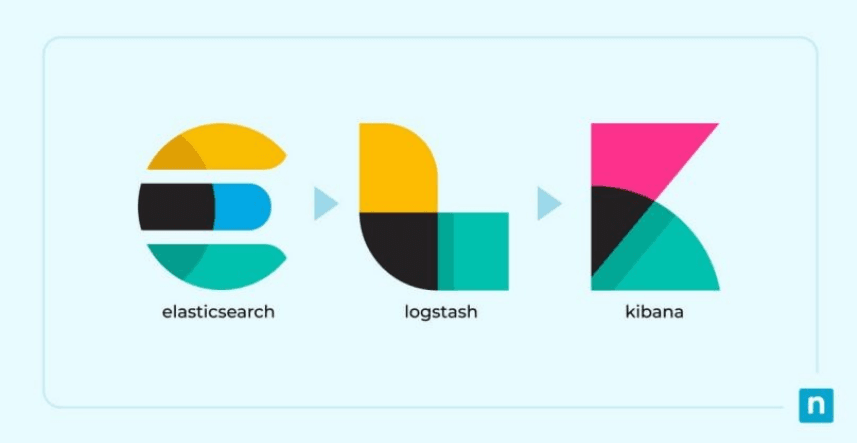
The ELK Stack#
The ELK Stack is the name of the combined triplet of three open-source tools from Elastic, namely Elasticsearch, Logstash, and Kibana. Data can be collected from any source or format to do searching and analyzing with result visualization.
1. Elasticsearch#
- A NoSQL database based on the Lucene search engine.
- Stores and indexes logs with efficient structures for faster searching.
- Developed in Java, it works on any platform.
- Very good at handling large streams of data, for example, logs.
2. Logstash#
- Collecting logs from various sources (applications, servers, databases, etc.).
- Parse, transform, and filter the logs before storing them.
- Buffers and sends data to Elasticsearch for indexing.
- It is able to integrate with many different types and protocols of logs.
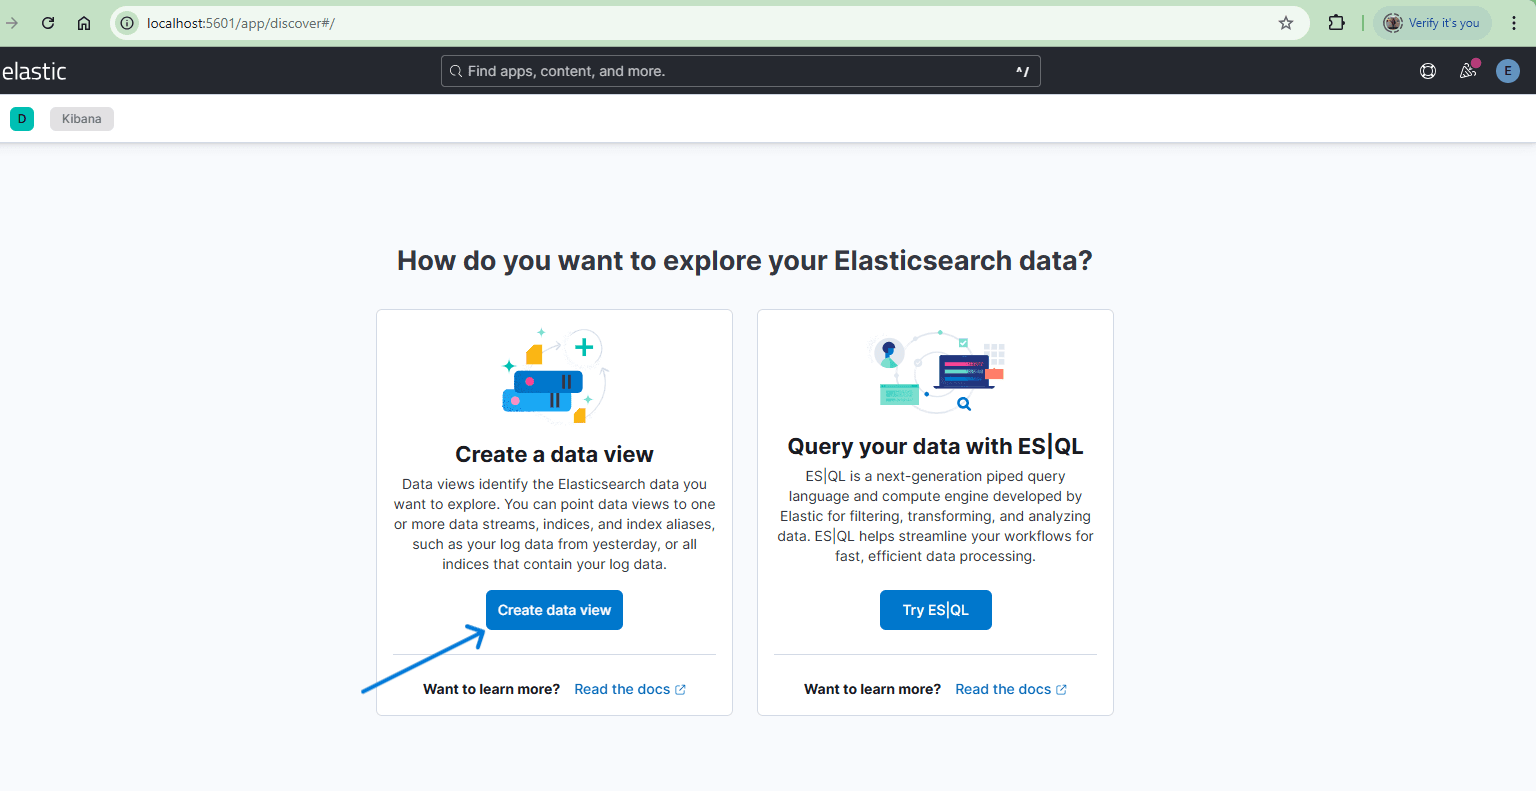
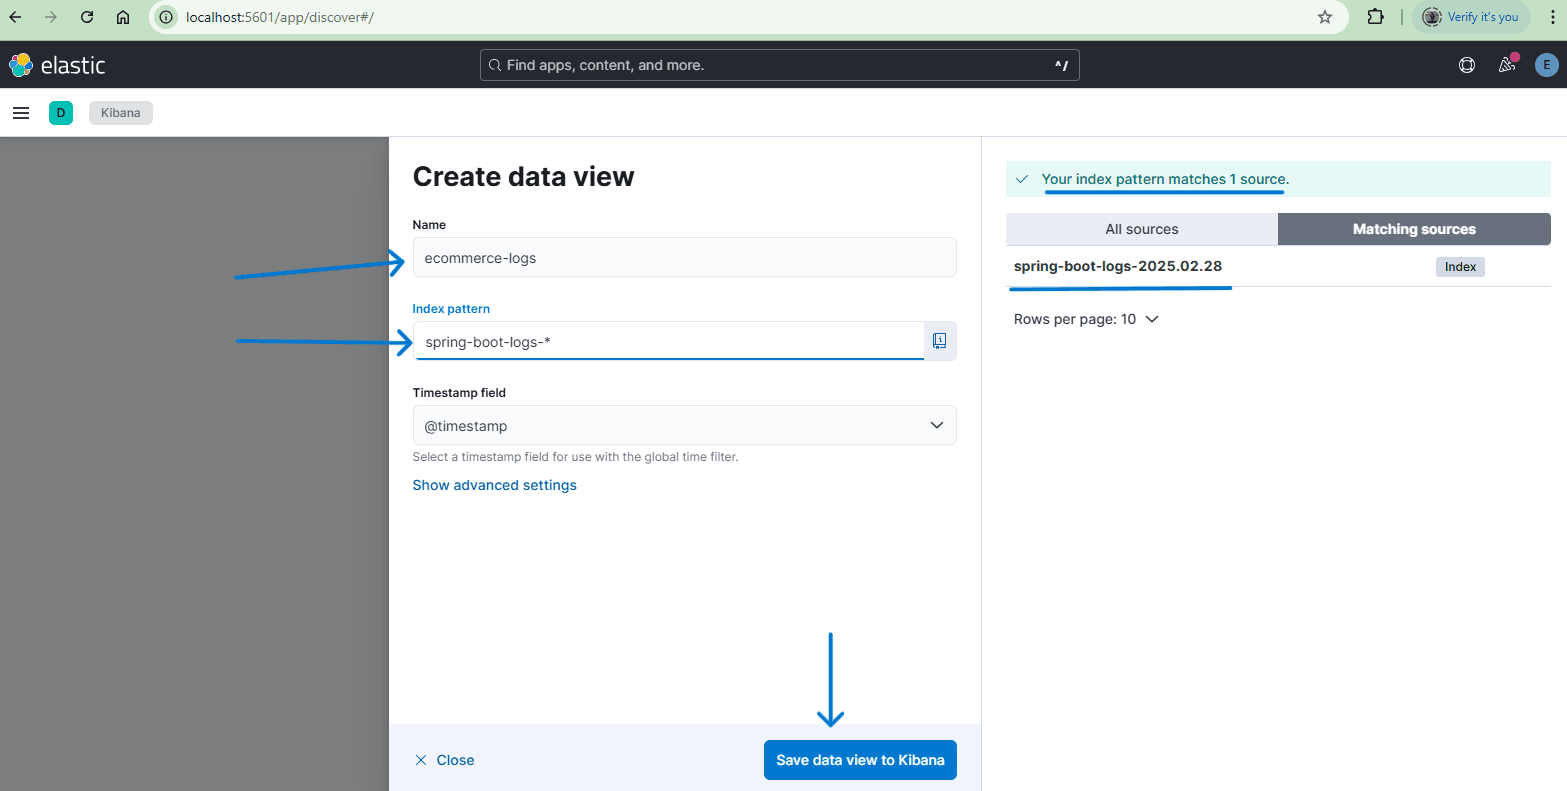
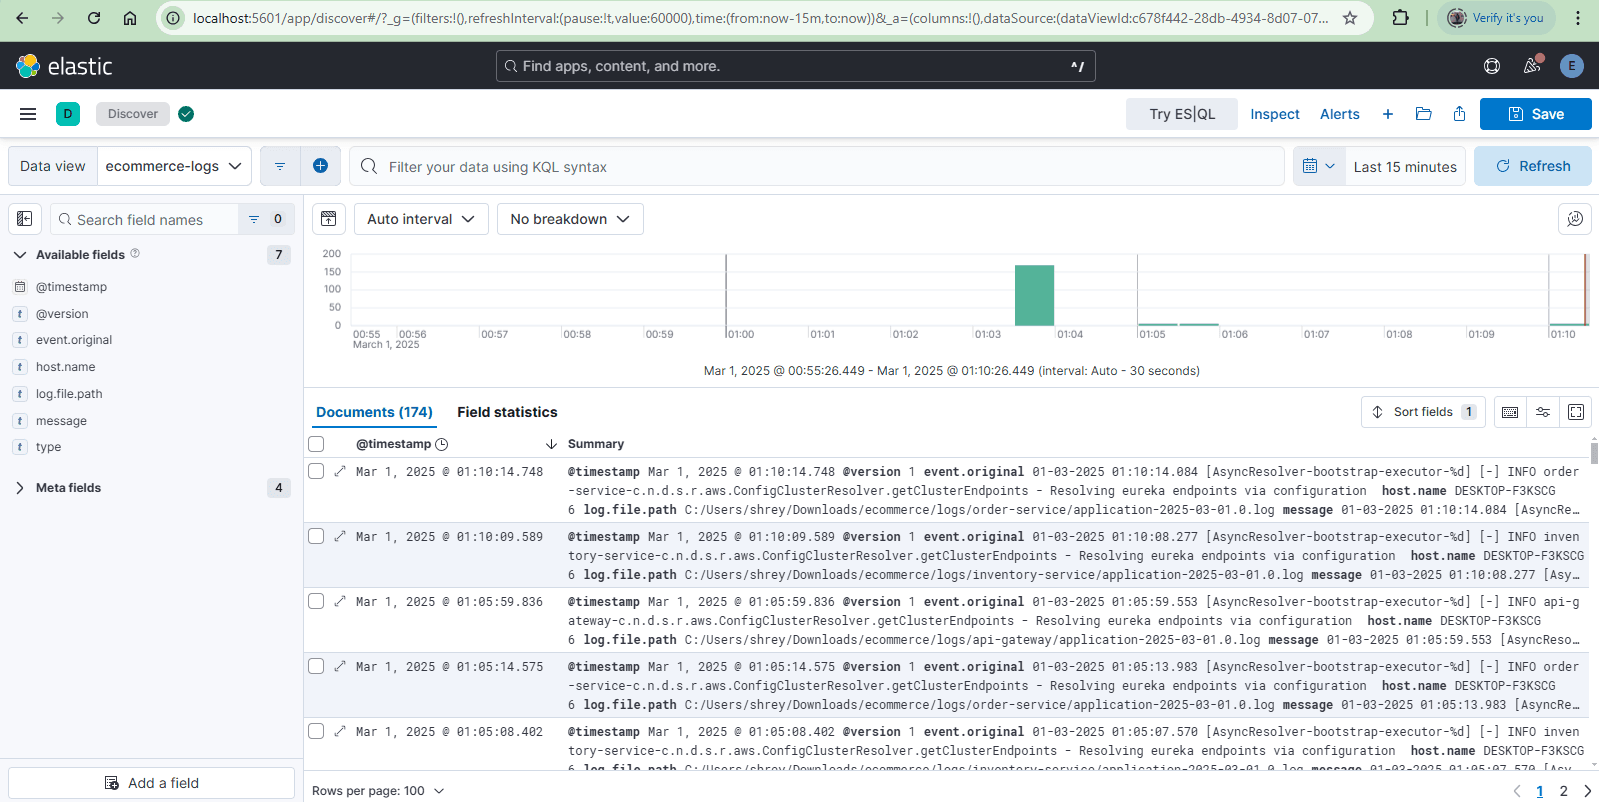
3. Kibana#
- Provides a visualization and analytics layer on top of Elasticsearch.
- Helps users search, view, and interpret log data.
- Provides the ability to create dashboards, graphs, and reports for insights.
Together, these three components make it possible to have centralized logging, real-time monitoring, and an analytical power system, thus making it one of the must-have tools available for microservices logging and observability.
Installing the ELK Stack#
- Guidance links
- https://www.elastic.co/guide/en/kibana/current/install.html check the guidance for Kibana
- https://www.elastic.co/guide/en/logstash/current/installing-logstash.html check the guidance for Logstash
- https://www.elastic.co/guide/en/elasticsearch/reference/current/install-elasticsearch.html check the guidance for Elasticsearch
- Download: (Choose the platform and download)
- ElasticSearch: https://www.elastic.co/downloads/elasticsearch
- Logstash: https://www.elastic.co/downloads/logstash
- Kibana: https://www.elastic.co/downloads/kibana
- Running the ELK Stack
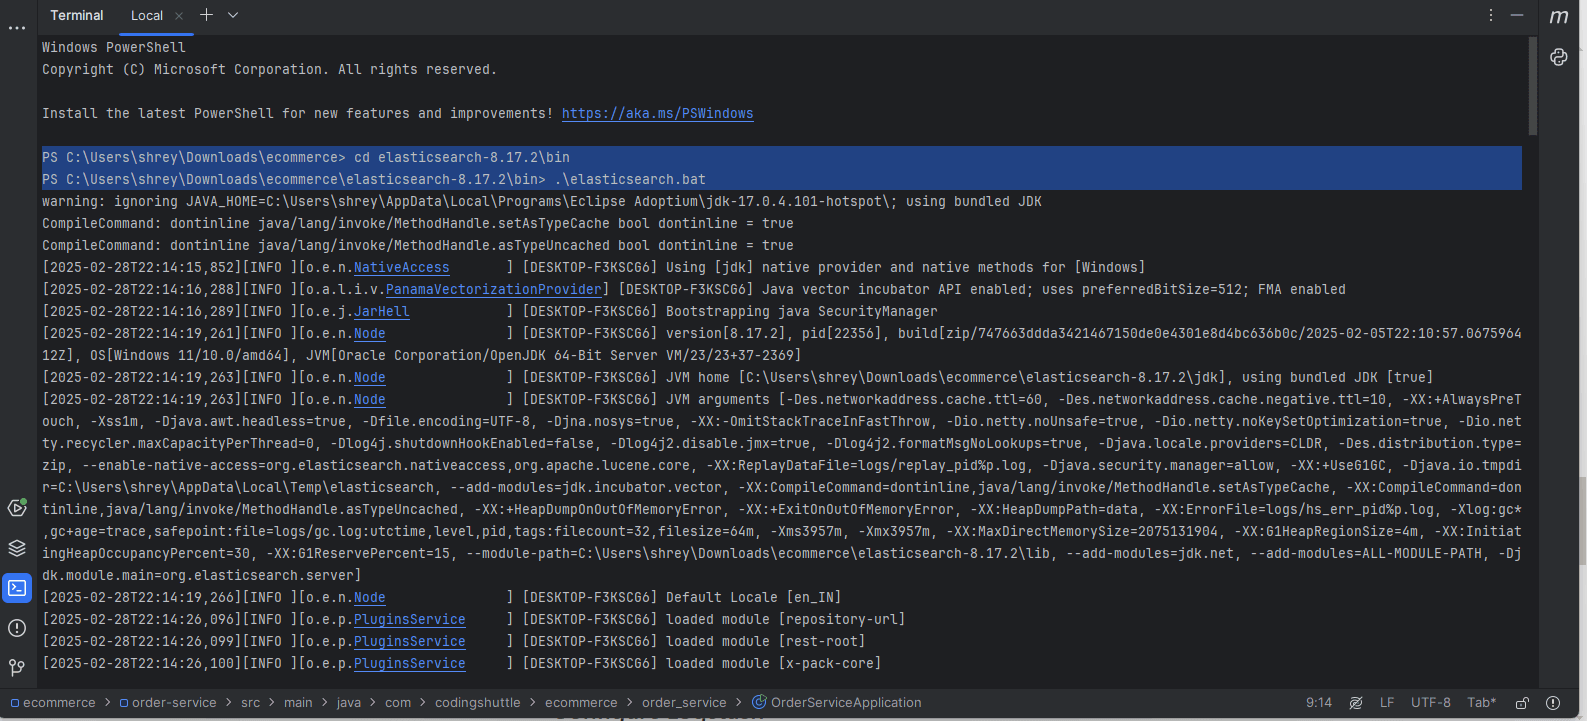
- Start Elasticsearch
- Windows (Command Prompt / PowerShell)
- Start Elasticsearch
- Linux / macOS (Terminal)
- Start Logstash
- Windows
- Linux / macOS
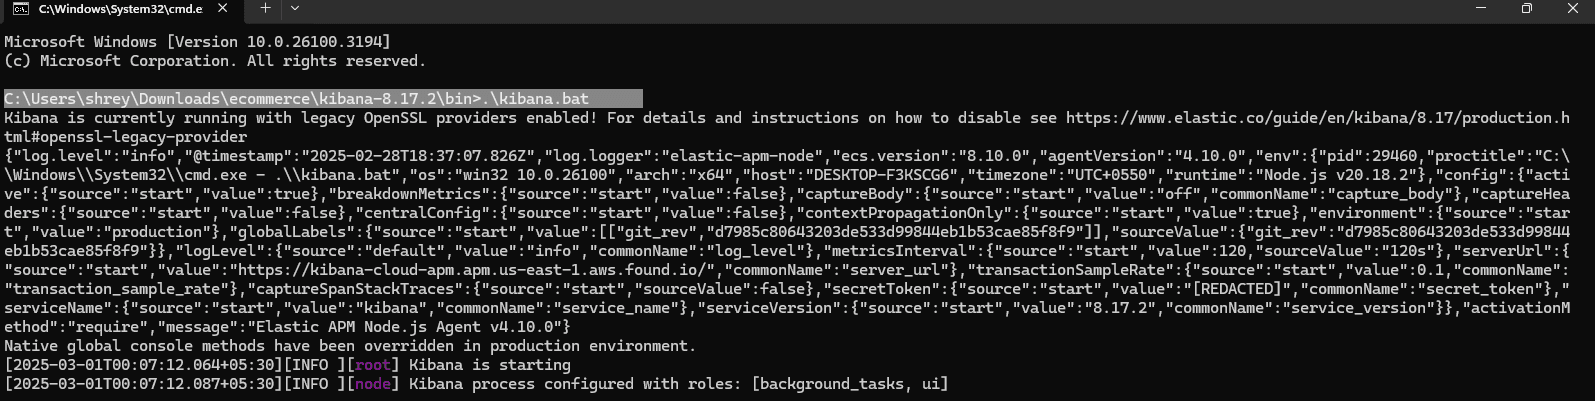
- Start Kibana
- Windows
- Linux / macOS
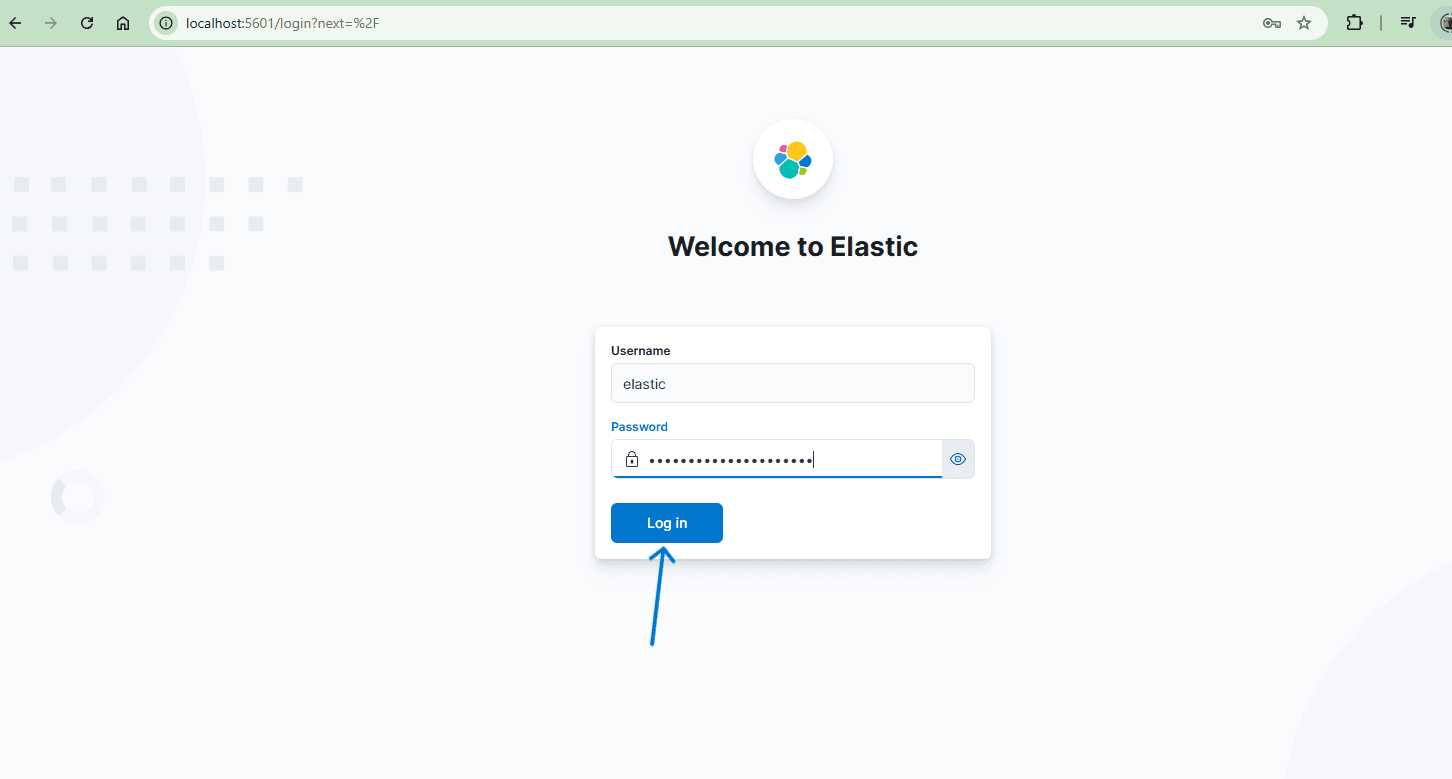
Verify Installation
Check if services are running:
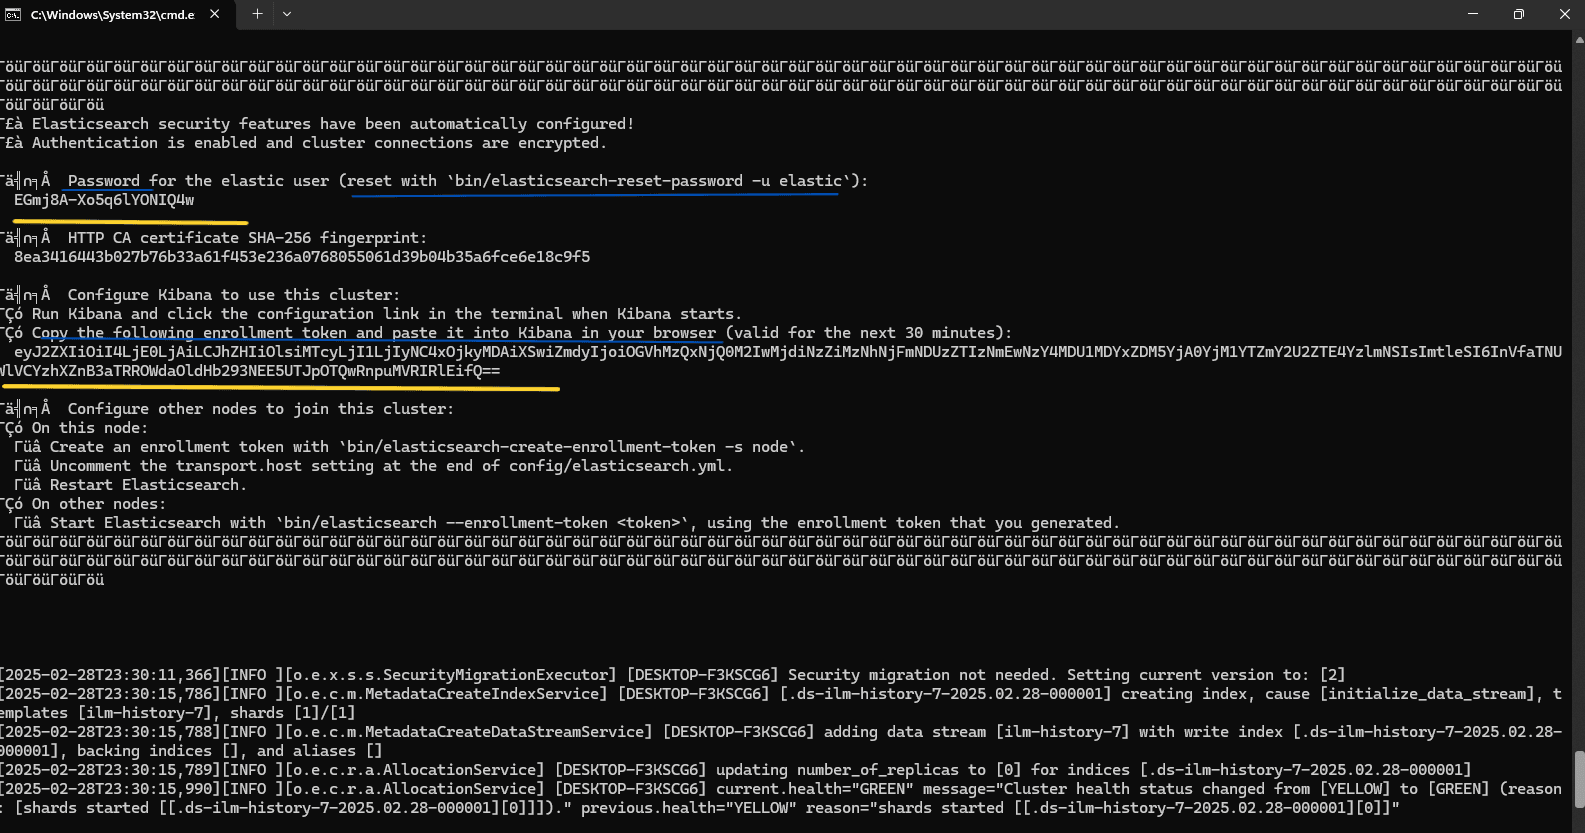
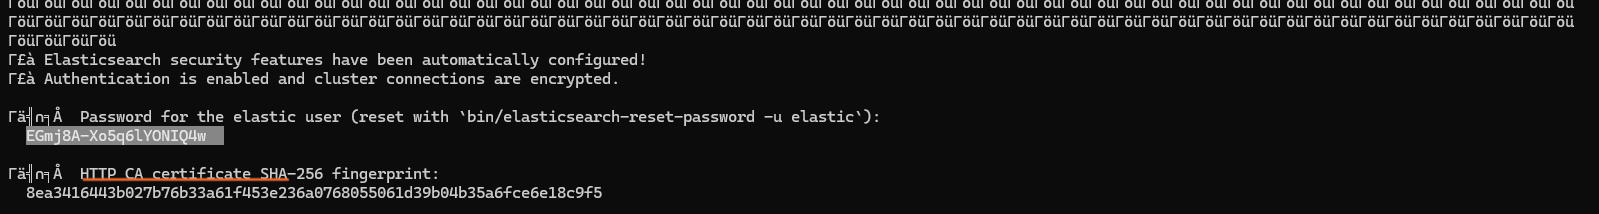
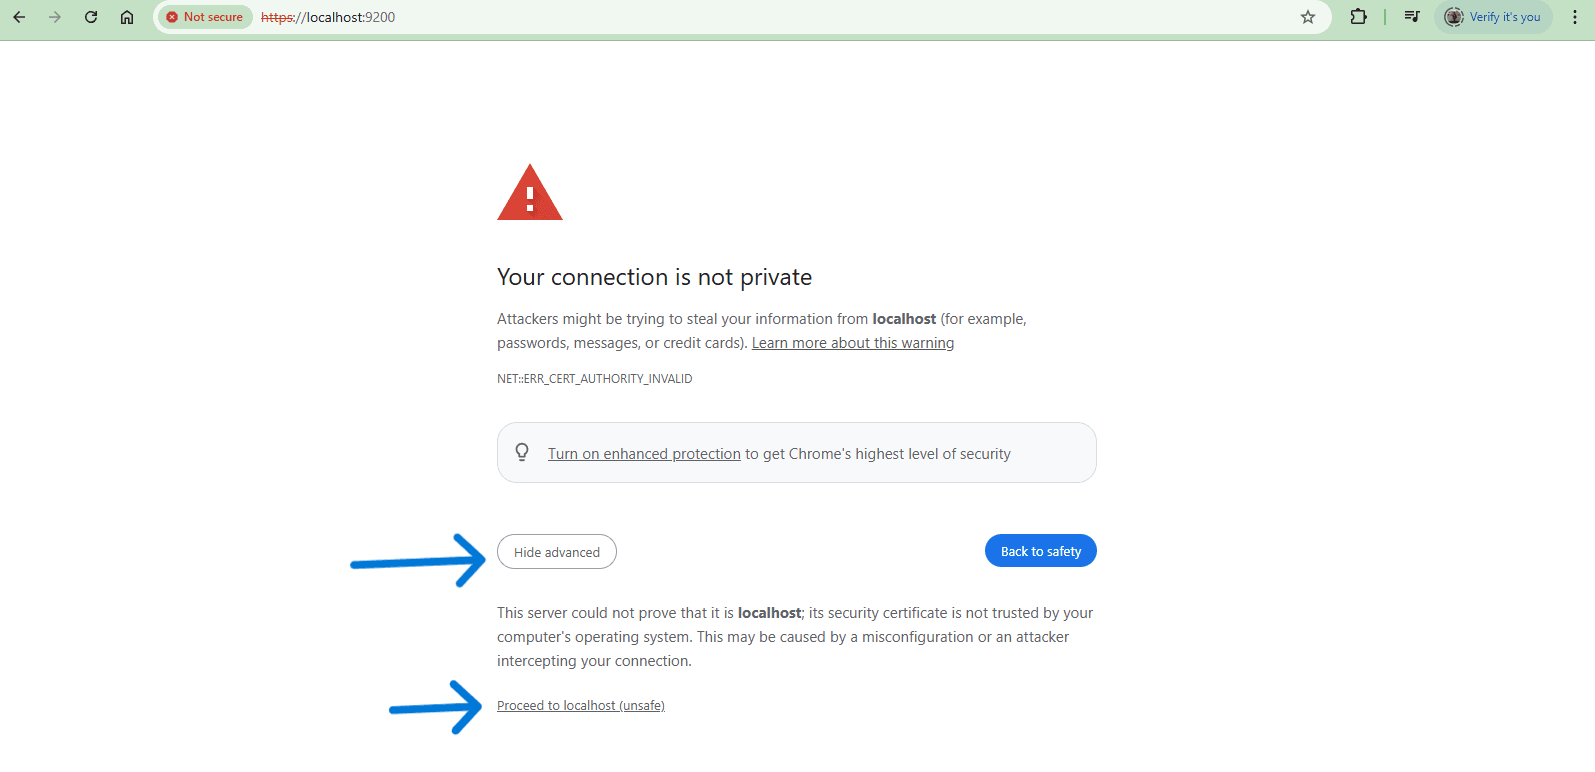
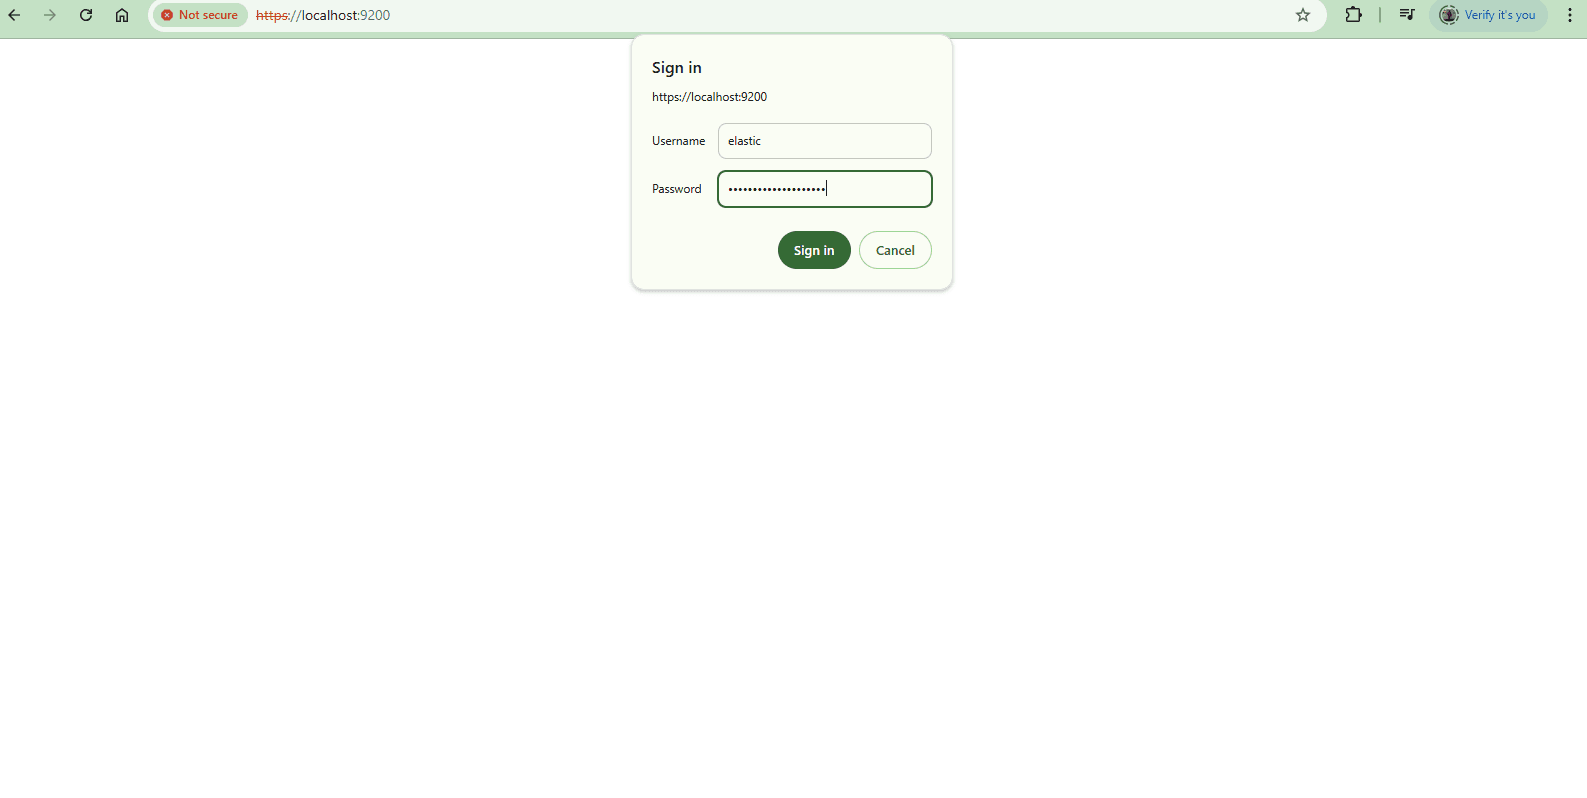
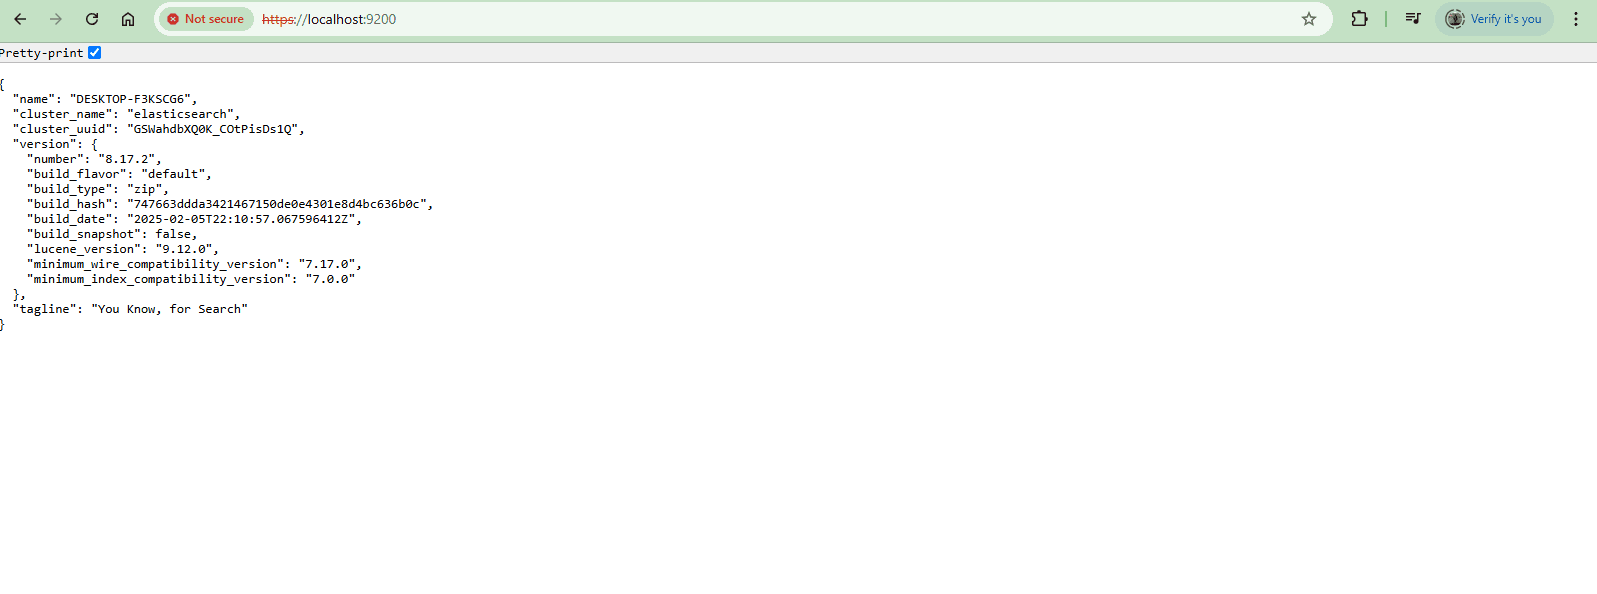
- Elasticsearch: Open
https://localhost:9200in your browser. You should see a JSON response.
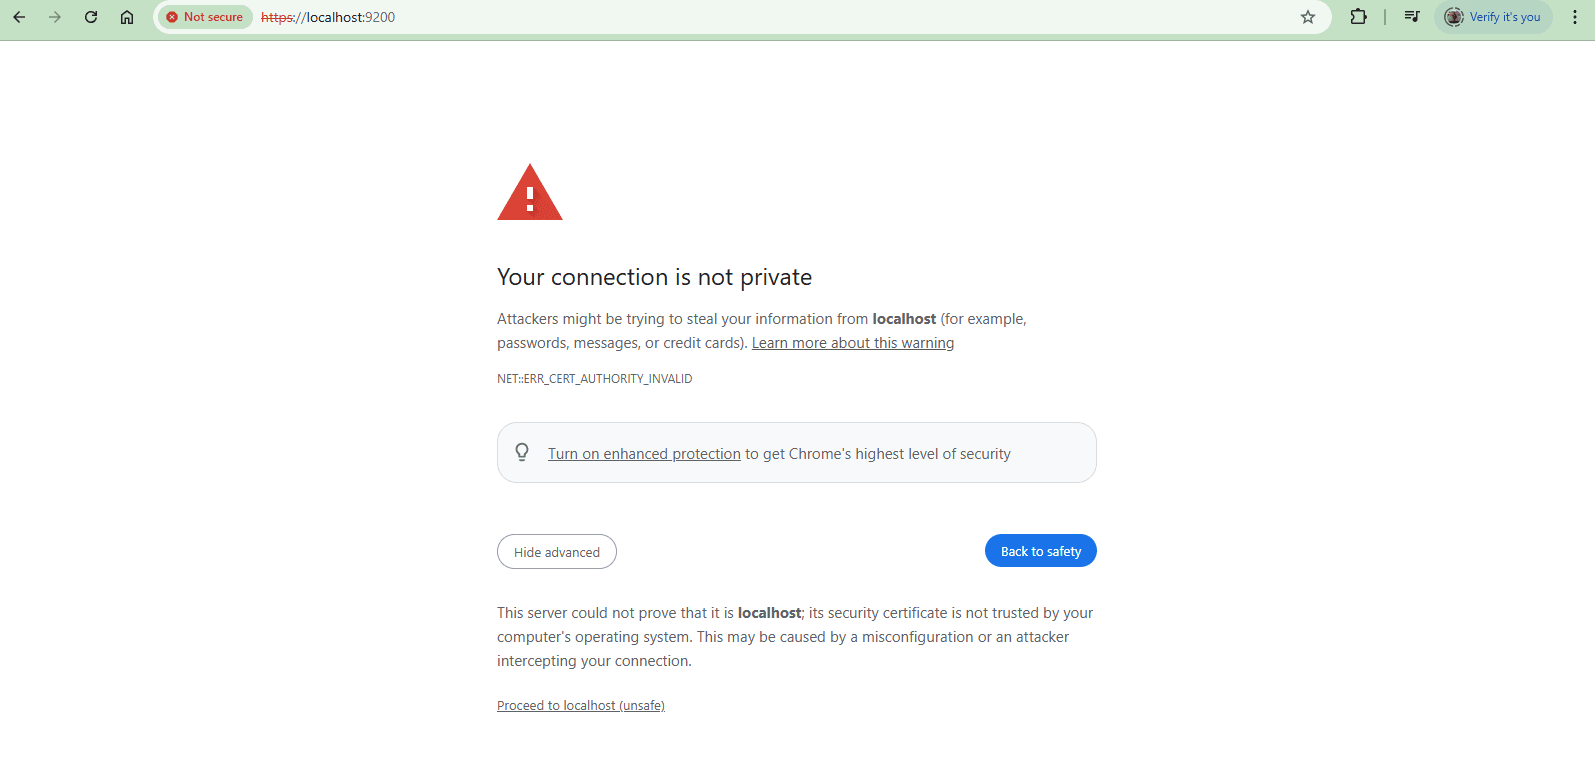
- For http CA certified. We need to add https . Also need the password.
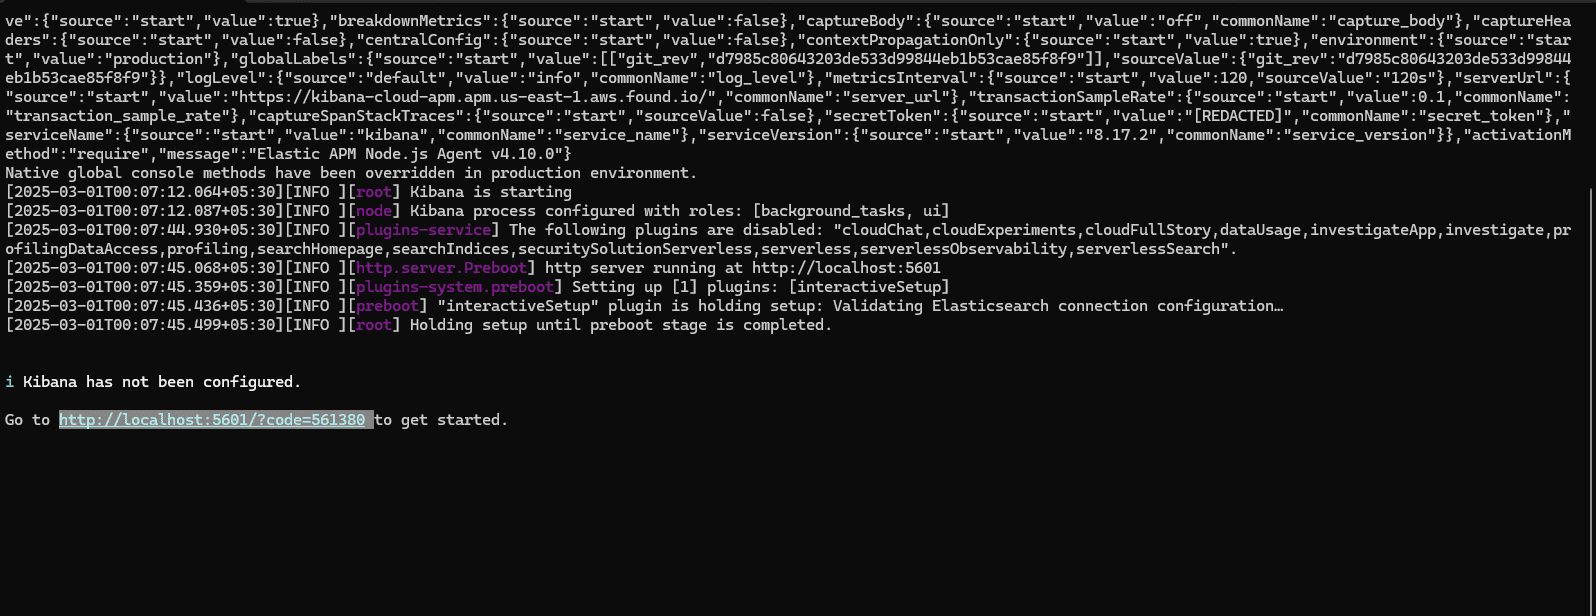
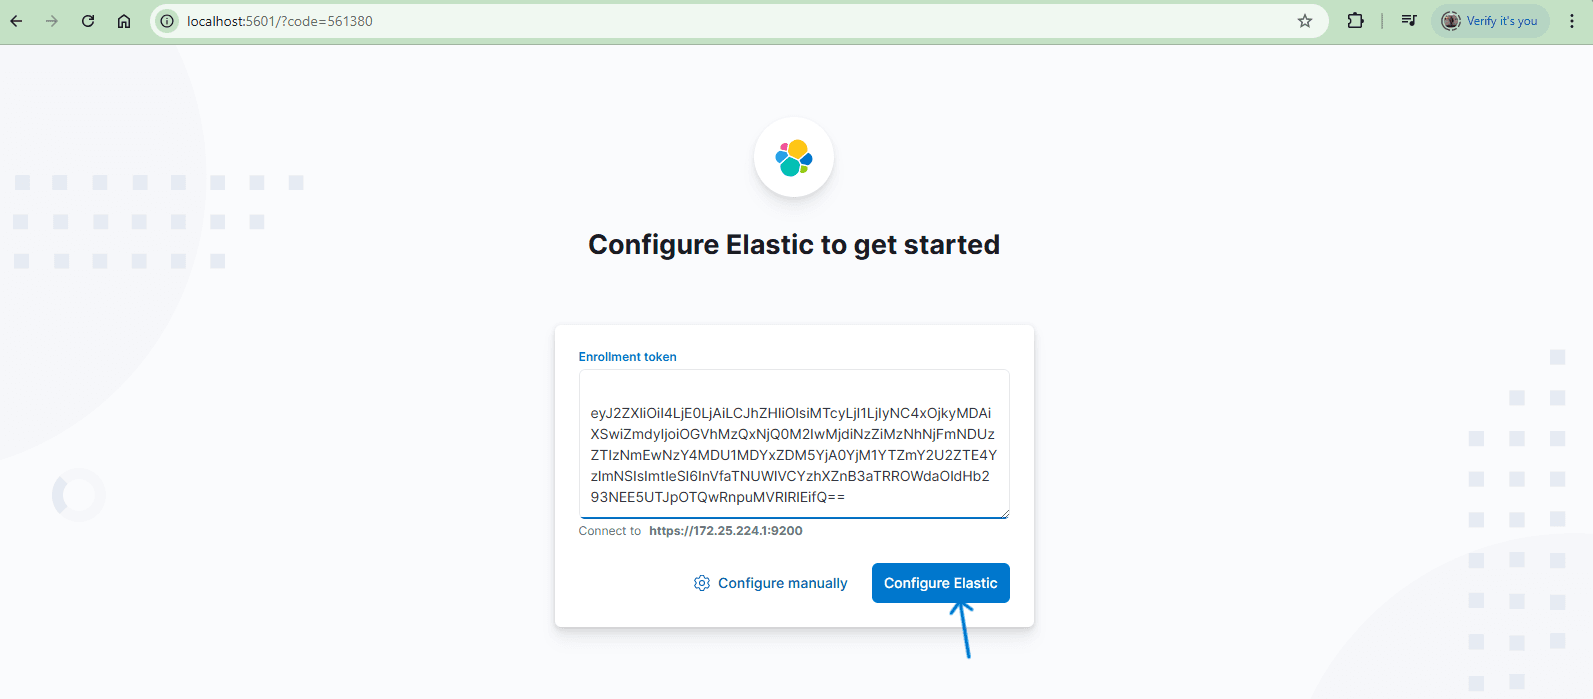
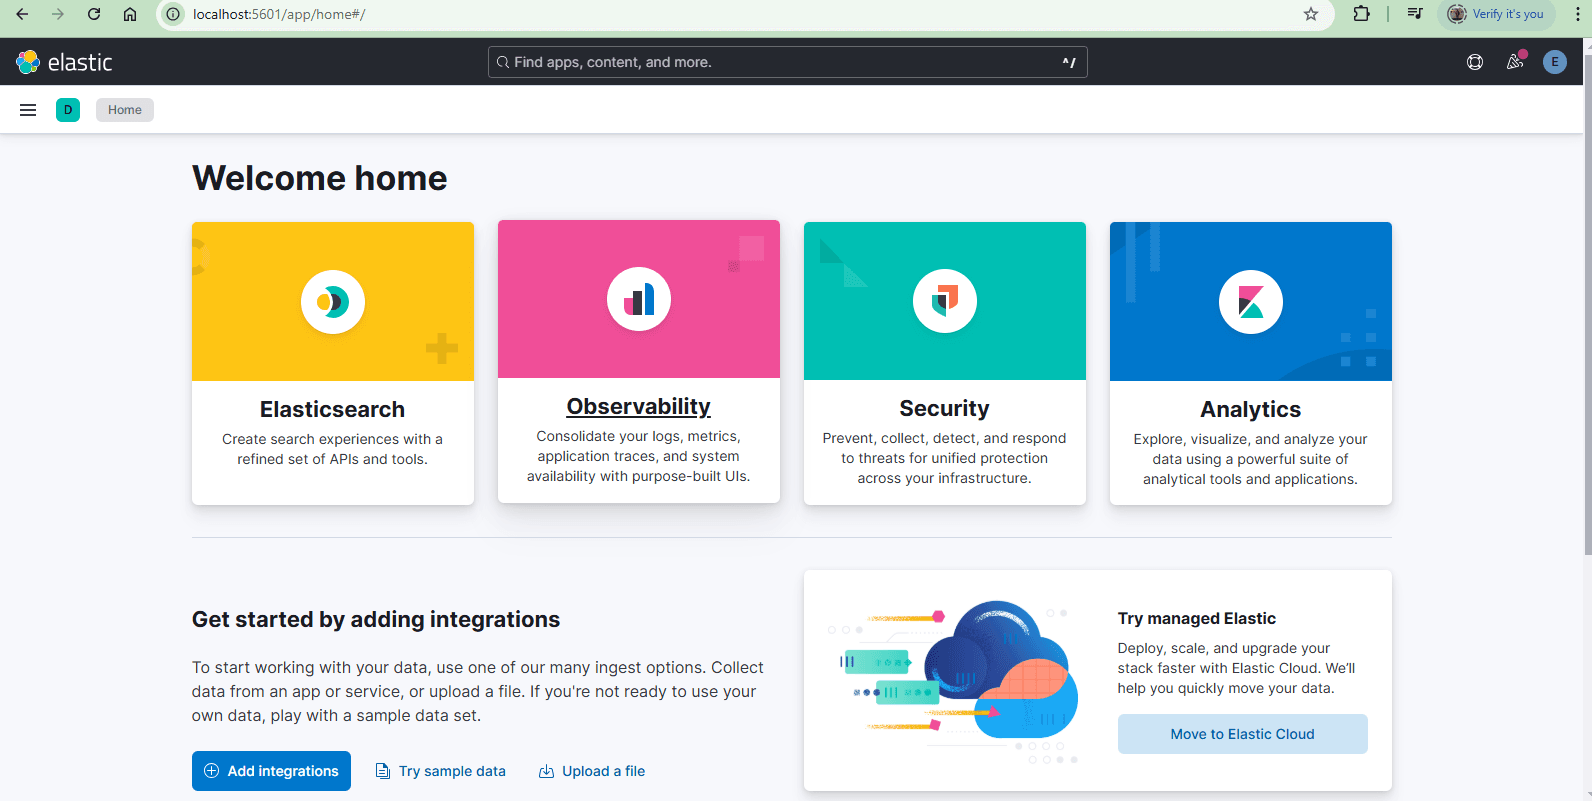
- Kibana: Open http://localhost:5601/?code=561380 . The Kibana dashboard should load.
Just copy the token which is generated by Elasticsearch.
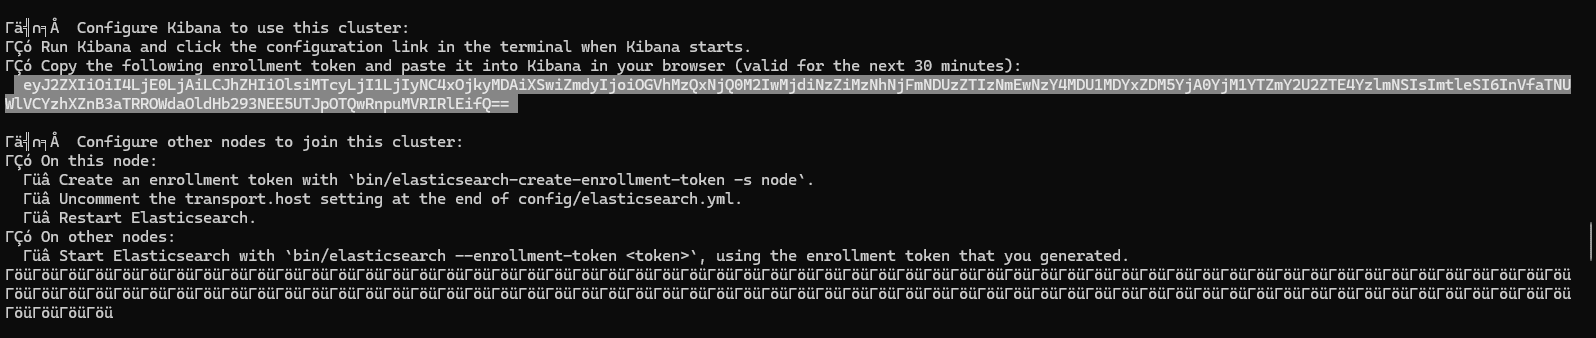
Paste here.
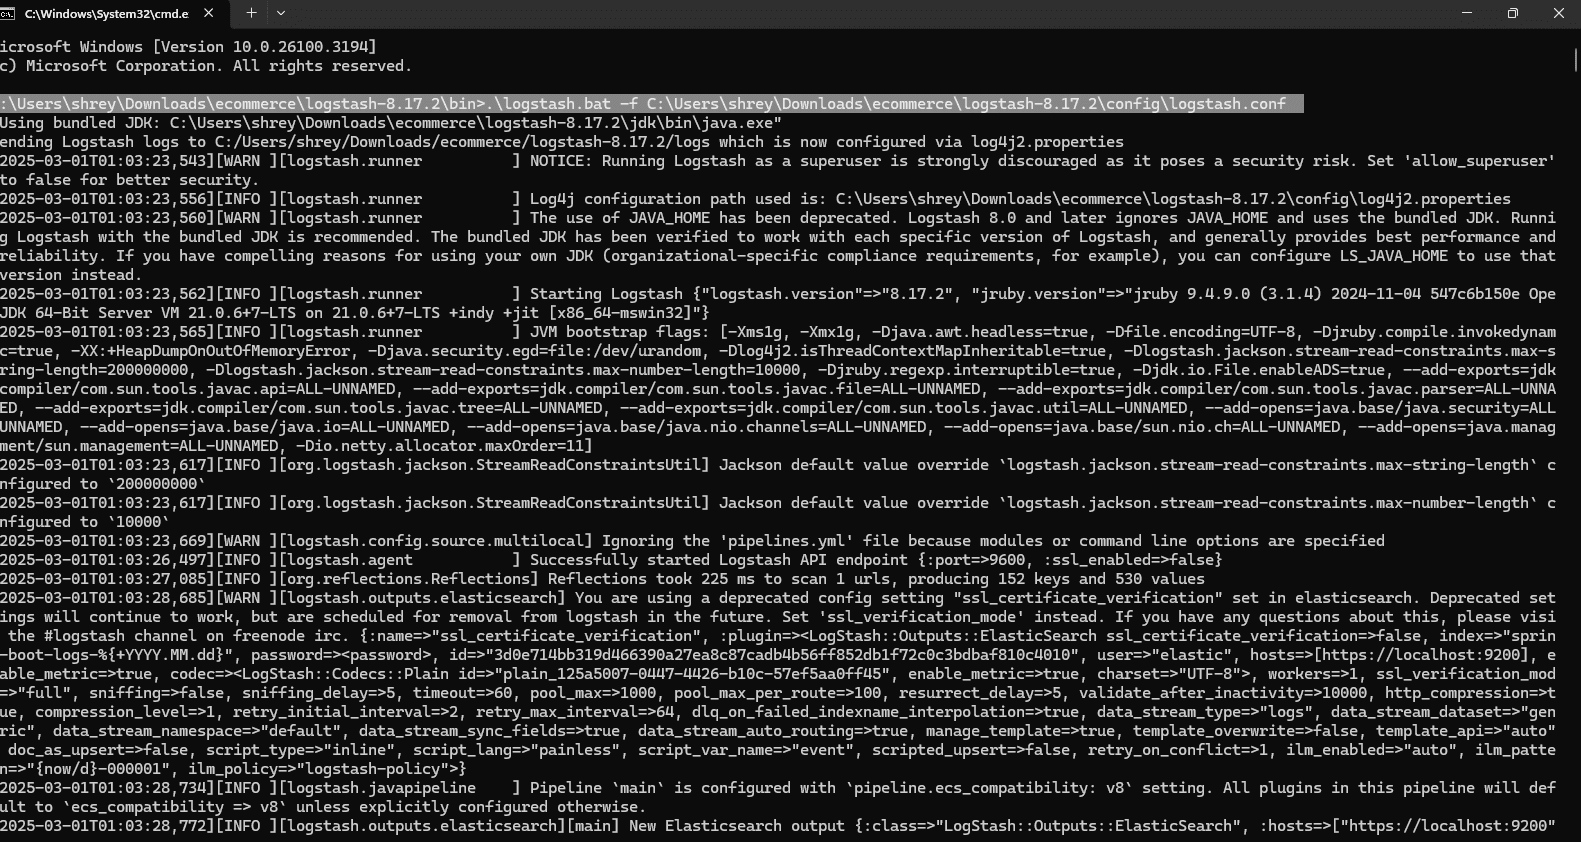
- Logstash: Logs should start processing as per your logstash.conf configuration.
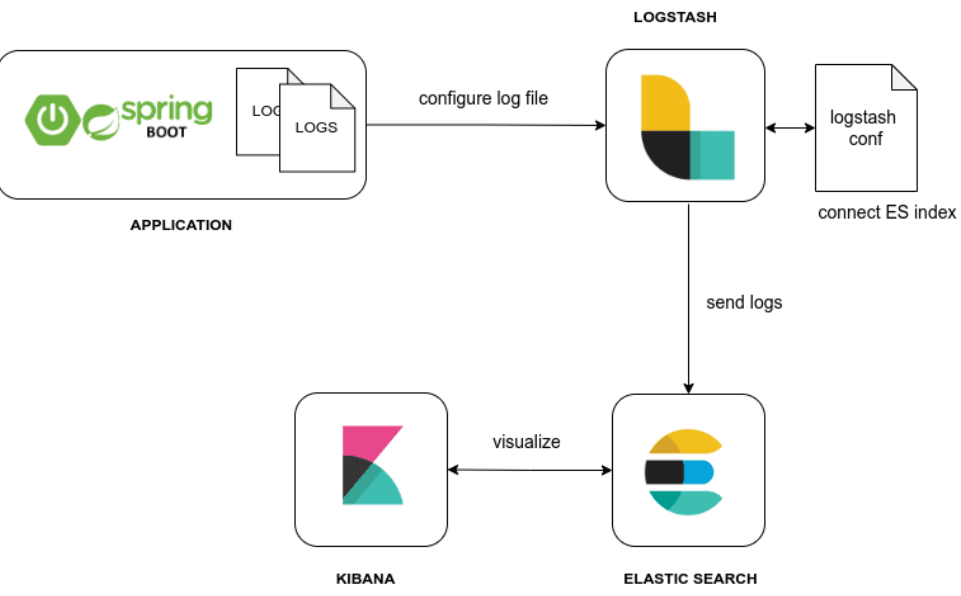
Configure Logstash#
To set up Logstash for collecting and forwarding logs to Elasticsearch, follow these steps:
Step 1: Configure Application Logs (logback-spring.xml)#
In your Spring Boot application, create a logback-spring.xml file in src/main/resources to generate logs. This will create logs/application.log and store logs there.
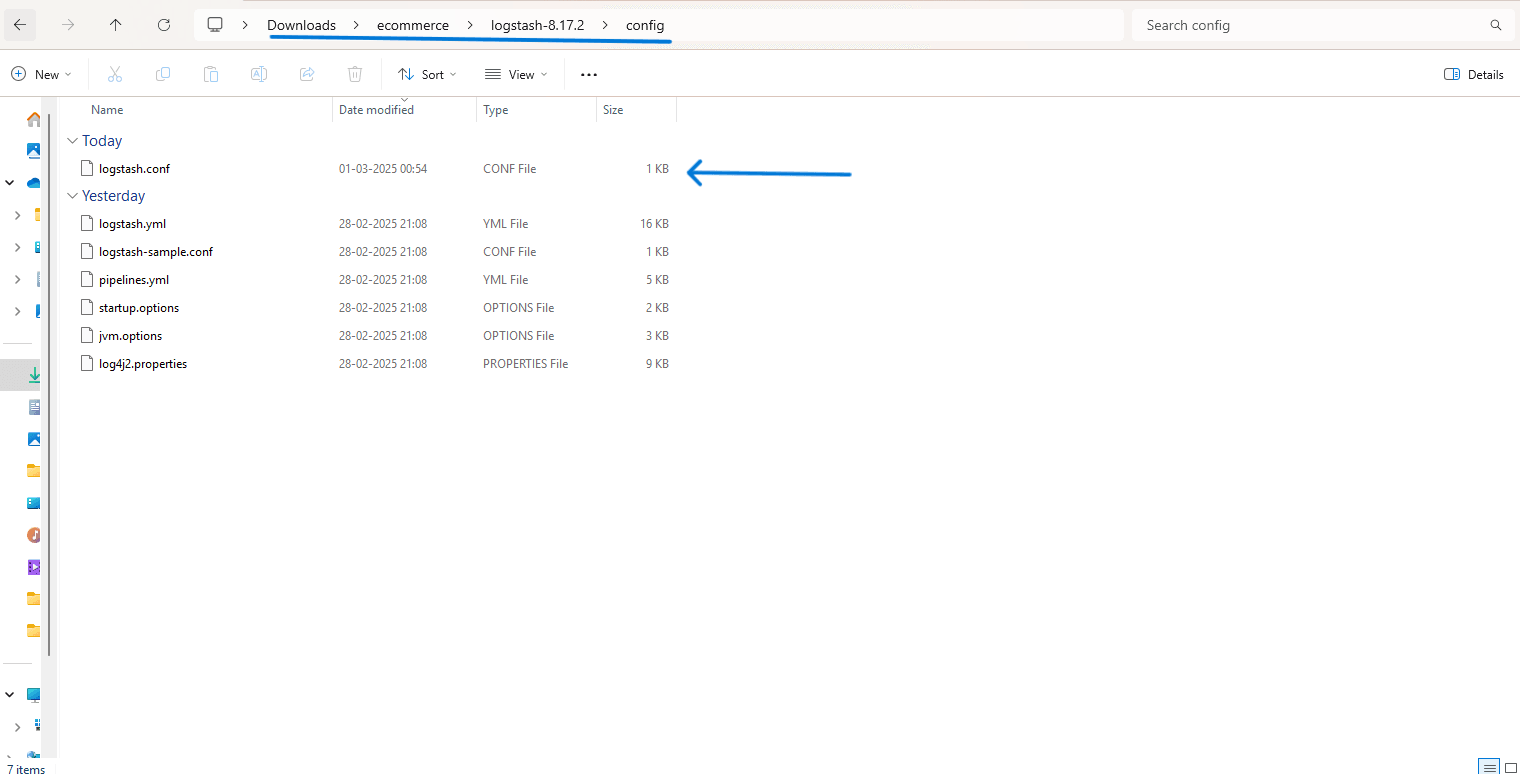
Step 2: Create Logstash Configuration (logstash.conf)#
Go to your Logstash installation folder and create logstash.conf.
Step 3: Define Logstash Input & Output#
How does Logstash work?#
Logstash acts as a log processor that collects, transforms, and forwards logs to various destinations like Elasticsearch. Here’s how it works:
1. Reading Log Entries#
- Logstash continuously monitors log files or receives data from different sources like databases, applications, or cloud services.
- Each log entry (line of text) is treated as a separate event.
2. Processing and Sending Logs#
- Logstash parses, filters, and enriches log data using plugins.
- For example, it can extract timestamps, user IDs, IP addresses, or error levels from logs.
- Once processed, Logstash sends the logs to configured destinations like Elasticsearch for storage and analysis.
3. Indexing in Elasticsearch#
- Elasticsearch indexes the logs, making them searchable.
- This allows tools like Kibana to visualize the logs in dashboards.
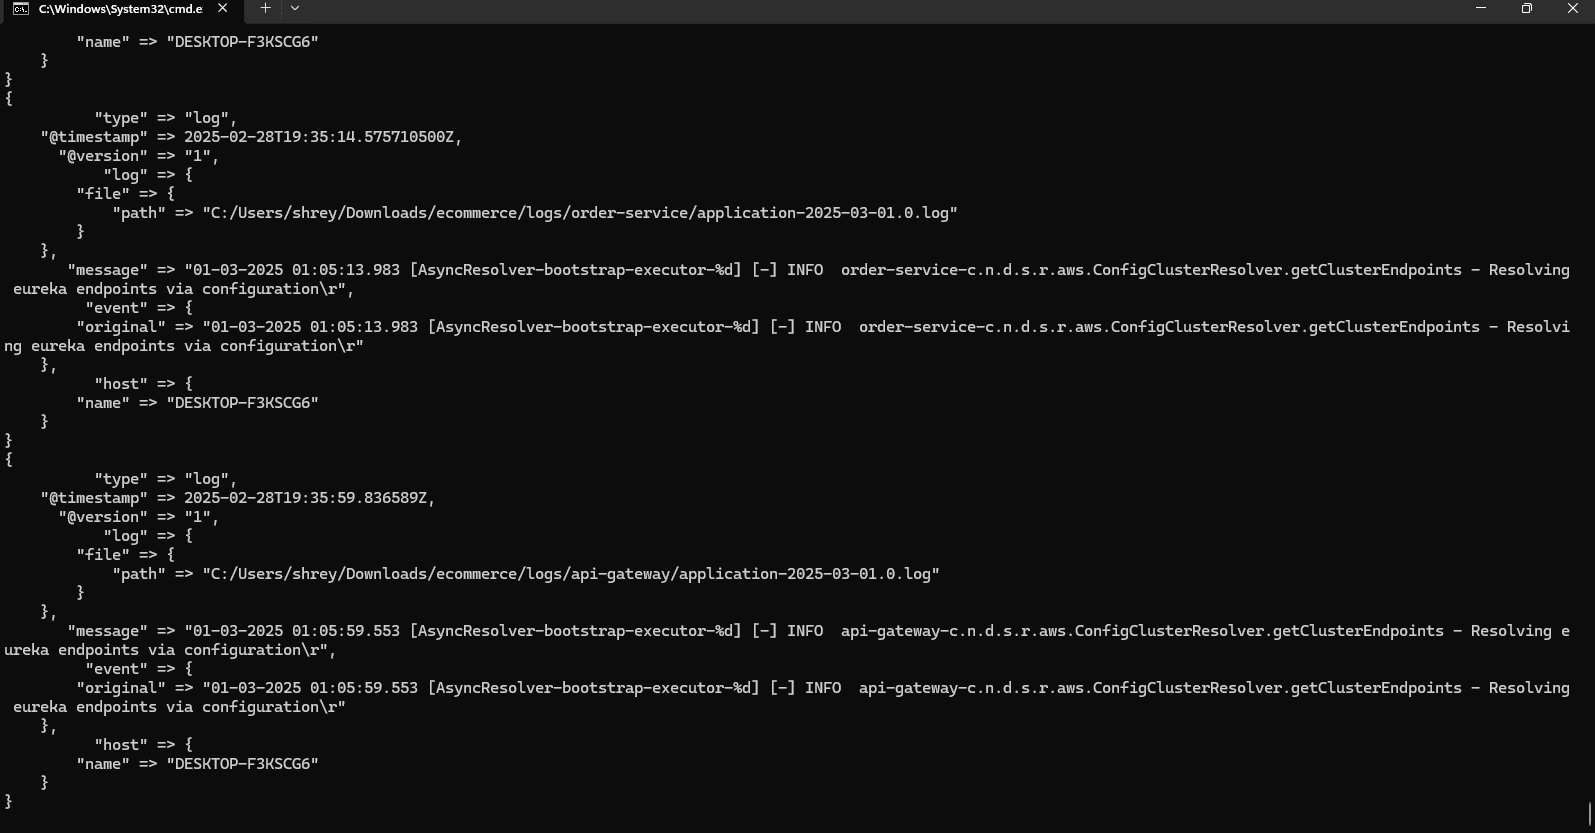
Example:
If an application generates error logs, Logstash can collect them, filter out unnecessary details, and send them to Elasticsearch. You can then search, analyze, and visualize the logs in Kibana.
Conclusion#
The article explores centralized logging in microservices using the ELK Stack (Elasticsearch, Logstash, and Kibana). It explains how Logstash collects logs, Elasticsearch indexes them, and Kibana visualizes them for real-time monitoring and debugging, enhancing system observability and troubleshooting efficiency.