Microservice Advance: Distributed Tracing using Zipkin and Micrometer
Introduction#
The services may work together, but tracking requests across microservices requires extraction of information for debugging or performance monitoring from many different services. Distributed tracing helps establish that visibility.
This guide covers Zipkin and Micrometer:#
- Zipkin collects and visualizes trace data across services.
- Micrometer works with your monitoring tools in addition to supporting distributed tracing. When bringing these tools into a Spring Boot application, you can then trace requests, analyze latency, and improve system observability, leading to better debugging of performance optimization.
Real-Time Analogy#
In microservices, distributed tracing is the closest analogy for parcel tracking in a courier service. In the case of a tracking system, it logs the journey of a parcel through multiple checkpoints; on the other hand, Zipkin traces requests as they make their way through different services. Micrometer records its performance metrics, allowing us to identify bottlenecks. As a result, debugging, performance monitoring, and system reliability are greatly enhanced for microservices.
Distributed Tracing#
Tracking tracing methodologies gracefully; requests will be tracked once they enter a distributed system such as microservices or an application in a cloud-native architecture. Furthermore, there is a glimpse of how the request is processed across various applications, services, and databases. Developers make efforts to diagnose and improve performance through system reliability enhancement.

Micrometer (Micrometer-Zipkin Documentation)#
A micrometer is a kind of apparatus that watches developers without demanding much from their microservices. The idea is that it gives a simplified façade over the instrumentation clients for all popular monitoring systems.
This is an application metrics façade that is vendor-neutral. Application metrics using Micrometer will be used to observe, alert on, and act upon the direct and near-past operational state of the environment. This will act as a metrics façade for Amazon CloudWatch, Elasticsearch, Prometheus, and Zipkin.
Zipkin (Micrometer-Zipkin Documentation)#
Zipkin is among those tools benefitting software developers in tracing request items across different parts of a distributed system. The tool allows you to visually represent how a request traverses different microservices in processing. It assists in understanding the time for request processing. Bottlenecks are evaluated within the request processing time, and requests are raised regarding issues in microservices architecture.
Installation Process for Zipkin#
To install Zipkin using a standalone JAR, follow these steps:
- Go to Quickstart: Visit https://zipkin.io/pages/quickstart.html
- Download the JAR: Navigate to Java jar > Click “Latest” to download the latest Zipkin server JAR.

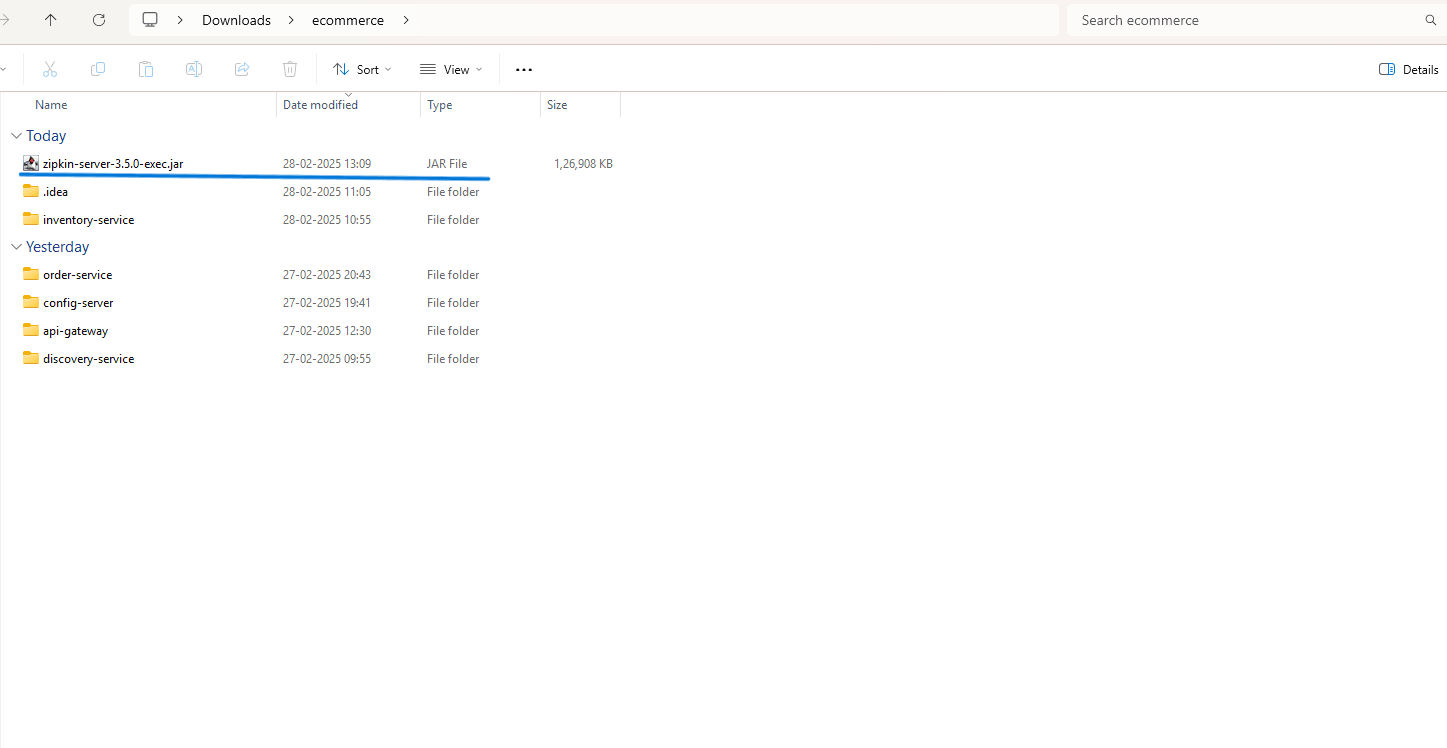
- Move the JAR File: Place the downloaded Zipkin JAR inside your ecommerce project folder.
- Open Terminal/CMD: Navigate to the folder where you placed the .jar file
- cd path/to/ecommerce
- Run Zipkin: Open a terminal and run ( Command)
- java -jar zipkin-server-<latest version>-exec.jar
I am using version 3.5.0. Command: java -jar zipkin-server-3.5.0-exec.jar .

- Verify the Setup: Once running, open http://localhost:9411 in your browser to access the Zipkin UI.

Checking Traces by Adding Micrometer to a Spring Boot 3 Application#
1. Add Micrometer Maven Dependencies#
2. Add Spring Boot Actuator Dependency#
3. Configure Tracing Sampling Probability#
4. Tracing HTTP Request Sent with Feign#
When using OpenFeign in a Spring Boot 3 application, you can trace outgoing HTTP requests using Micrometer Tracing and Zipkin.
Add Required Dependencies in pom.xml
MicrometerCapability bean
Now that you have a maven dependency, you can create a MicrometerCapability bean.
Output After Running Zipkin#
1. Run all services:#
After running all services (the sequence is 1. Run Eureka Server (Discovery Service) 2. Run other clients services. 3. Last run gateway service on default port 8080)
2. Wait for all registered client services inside Eureka:#
if your services are not fully registered before another service tries to communicate with them, you may encounter a "Service Unavailable" exception.
3. Hit the url http://localhost:8080/api/v1/orders/core/create-order in the Browser or Postman with the request body: When you make API calls to your services (e.g., using Feign clients):#
After starting Eureka and all client services, test the API using a browser (for GET requests) or Postman (for all requests). If you are trying to fetch other services you can easily fetch it. Here, we are trying to fetch inventory service data by using api-gateway (port=8080). /api/v1 ignored because of using StripPrefix=2 . We need to comment “RedirectTo=302, <http://codingshuttle.com>” and “AddRequestHeader=X-Custom-Header, ABCD” from the gateway filter.

Expected Output When Tracing Requests in Spring Boot#
- When you make API calls to your services (e.g., using Feign clients):
- The logs in your Spring Boot application should show trace IDs and span IDs
- [TRACE_ID=1234abcd] Handling request for /api/orders
- [SPAN_ID=5678efgh] Calling external service /api/products
- The logs in your Spring Boot application should show trace IDs and span IDs

- The traces will be collected and sent to Zipkin.
- Checking Traces in Zipkin:
- Open http://localhost:9411 and click "Find Traces".
- You should see recorded traces with timestamps and latency details.
- Clicking on a trace will show:
- Start time, duration
- List of spans (representing calls between services)
- Dependency graphs (showing interactions between services)
- After clicking “RUN QUERY”

- After clicking “SHOW”

- Go to “Dependencies” > Click “RUN QUERY”. You can see the connection tree.

Conclusion#
The article explains distributed tracing in a microservices architecture with an elaboration on tracking request flows using Zipkin and performance metric collection via Micrometer for good debugging, monitoring, and optimization purposes.